

Learn how to create a payment process diagram step by step. Discover its importance, real-world applications in finance and business, detailed examples from PayPal, Stripe, bKash, and payroll systems, plus practical tools and advanced tips for designing effective diagrams.
Introduction
In today’s complex financial and business landscape, clear communication is the key to efficiency. Payments—whether in banking, e-commerce, payroll, or dividend distribution—often involve multiple steps and participants. Without a visual guide, these processes can feel overwhelming. That’s where a Payment Process Diagram comes in.
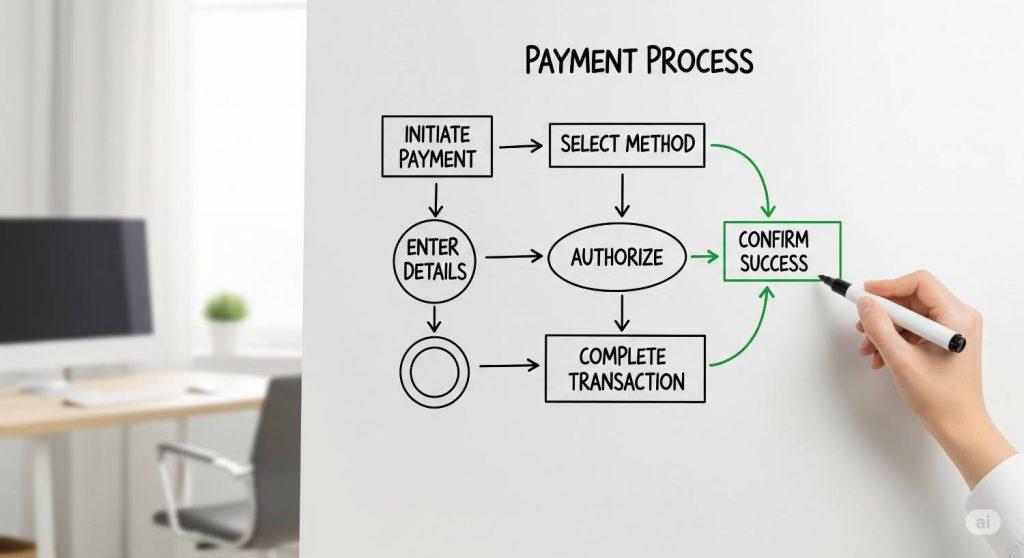
A Payment Process Diagram is a visual representation of how money moves from initiation to completion. It breaks down each step in a way that anyone can understand, from stakeholders to employees to customers. In this guide, you’ll learn not just what a payment process diagram is, but also how to create one step by step, supported by real-world examples and advanced tips.
By the end, you will be able to:
- Define what a payment process diagram is
- Understand its benefits and importance
- Explore real-world case studies (PayPal, Stripe, bKash, payroll, dividend payments)
- Create a diagram step by step using tools
- Apply best practices for accuracy and clarity
- Avoid common mistakes and adopt advanced techniques
What Is a Payment Process Diagram?

A Payment Process Diagram is a flow-based visual map that shows the sequence of steps involved in a payment transaction. It illustrates the interaction between different parties—such as companies, customers, banks, and payment gateways—until the final transfer of money is completed.
Example: Dividend Distribution Payment Process
- Company generates profits.
- Board of directors declares dividends.
- Record date identifies shareholders eligible for payment.
- Payment instructions are sent to banks or brokers.
- Dividends are credited into shareholder accounts.
When represented in a diagram, this becomes easy to follow for both investors and regulators.
Importance of a Payment Process Diagram
Payment process diagrams are more than just visuals—they are decision-making tools. Here’s why they matter:
- Clarity – They simplify complicated payment flows into easy-to-read steps.
- Transparency – Everyone understands how funds move through the system.
- Efficiency – Bottlenecks or delays can be identified and corrected.
- Training – New employees can quickly learn processes.
- Decision-making – Managers can use them to improve financial workflows.
Real-World Use Cases of Payment Process Diagrams

These diagrams are used across industries and financial systems. Let’s explore some key examples:
1. Dividend Distribution
Companies use diagrams to show how dividends are declared, approved, and paid to shareholders. This prevents confusion among investors.
2. PayPal Online Checkout
- Customer selects a product and clicks “Pay with PayPal.”
- PayPal redirects them to log in.
- Bank account or card is verified.
- PayPal confirms payment to the merchant.
- The seller receives funds.
3. Stripe API Payments
Stripe provides APIs for developers to integrate payments. A diagram shows how:
- Customer enters card details.
- Stripe encrypts and verifies payment.
- Bank approves or declines.
- Confirmation is sent back to the merchant.
- Funds are deposited.
4. bKash Mobile Payments (Bangladesh Example)
- Customer dials bKash USSD code or uses app.
- Selects send money or payment.
- Inputs recipient number and amount.
- bKash verifies transaction.
- Recipient receives instant payment.
5. Payroll System
Businesses map how employee salaries are processed:
- Attendance/working hours tracked
- Payroll system calculates salary
- Management approves payment
- Bank transfers salary to employees
6. B2B Invoice Payments
In supply chains, diagrams explain how invoices are issued, approved, and settled between businesses.
7. Banking Transactions
Banks use them to explain money transfers, bill payments, and loan disbursements.
Step by Step: How to Create a Payment Process Diagram
Follow these steps to design a clear and professional diagram:
Step 1: Define the Purpose
Decide what you want to illustrate. Is it payroll, online checkout, or dividend distribution?
Step 2: Identify Key Participants
List everyone involved:
- Business or company
- Customers or shareholders
- Banks
- Payment processors (PayPal, Stripe, bKash)
Step 3: Map the Process Flow
Write each step in order. Example (Stripe payment):
- Customer enters details.
- Stripe encrypts and sends to bank.
- Bank approves or rejects.
- Stripe informs merchant.
- Merchant receives funds.
Step 4: Select Diagram Type
Choose from:
- Flowchart – For simple transactions
- Swimlane Diagram – Separates actions by participant
- Data Flow Diagram (DFD) – Shows how data moves
Step 5: Use Diagram Tools
Popular tools include:
- Lucidchart
- Microsoft Visio
- Canva
- Creately
- Draw.io
- Miro (for team collaboration)
Step 6: Design the Diagram
- Use boxes for steps
- Arrows for direction
- Colors to separate roles
- Labels for clarity
Step 7: Review and Simplify
Ask: Can someone outside the process understand this easily? If not, refine it.
Example: Dividend Payment Process Diagram
Breaking down dividend payments:
- Company Earnings → Profits calculated
- Board Decision → Dividend declared
- Record Date → Eligible shareholders identified
- Ex-Dividend Date → New buyers after this date don’t get dividends
- Payment Date → Funds reach shareholders
This ensures investors and regulators understand every step.
Best Practices for Payment Process Diagrams
- Keep diagrams simple and readable
- Use consistent shapes and symbols
- Label every step clearly
- Ensure arrows show correct flow
- Update diagrams regularly
Common Mistakes to Avoid
- Overloading with unnecessary details
- Forgetting to include key participants
- Using unclear arrows or missing labels
- Failing to update diagrams after process changes
Advanced Tips for Professionals
To make your diagrams more effective:
- Add timestamps for time-tracking
- Use icons to represent participants
- Integrate diagrams with workflow automation tools
- Attach KPIs (Key Performance Indicators) for analysis
- Compare manual vs automated payment process diagrams to show improvements
Tools for Creating Payment Process Diagrams
- Lucidchart – Cloud-based, great for collaboration
- Microsoft Visio – Corporate standard for process diagrams
- Canva – Beginner-friendly, visually appealing
- Draw.io – Free, simple online tool
- Miro – Ideal for brainstorming and teamwork
FAQs About Payment Process Diagrams
Q1. What is a payment process diagram?
A flowchart-style map showing how payments are made step by step.
Q2. Why are they important?
They simplify complex processes, increase transparency, and boost efficiency.
Q3. Can I use it for dividends?
Yes, dividend distribution is one of the most common applications.
Q4. Which tools are best?
For professionals: Microsoft Visio or Lucidchart. For beginners: Canva or Draw.io.
Q5. Do I need technical skills?
No. Most tools are drag-and-drop.
Q6. How does PayPal’s payment process work?
A PayPal diagram shows login, verification, confirmation, and settlement.
Q7. Can I use it for mobile payments like bKash?
Yes, mobile money systems also benefit from process diagrams.
Q8. What’s the difference between manual and automated payment process diagrams?
Manual diagrams show human-driven steps, while automated diagrams integrate software-driven workflows.
Conclusion
A Payment Process Diagram is not just a chart—it’s a tool that improves clarity, efficiency, and decision-making. From PayPal and Stripe to bKash, payroll systems, and dividend payments, these diagrams are used globally to simplify financial transactions.
Key Takeaway: By creating a clear step-by-step diagram, you transform complex financial processes into easy-to-understand visuals. This helps businesses save time, reduce errors, and improve communication.
Know more related:
How to Analyze Trading Volume in the Stock Market